Winter 2020
Decade in Review
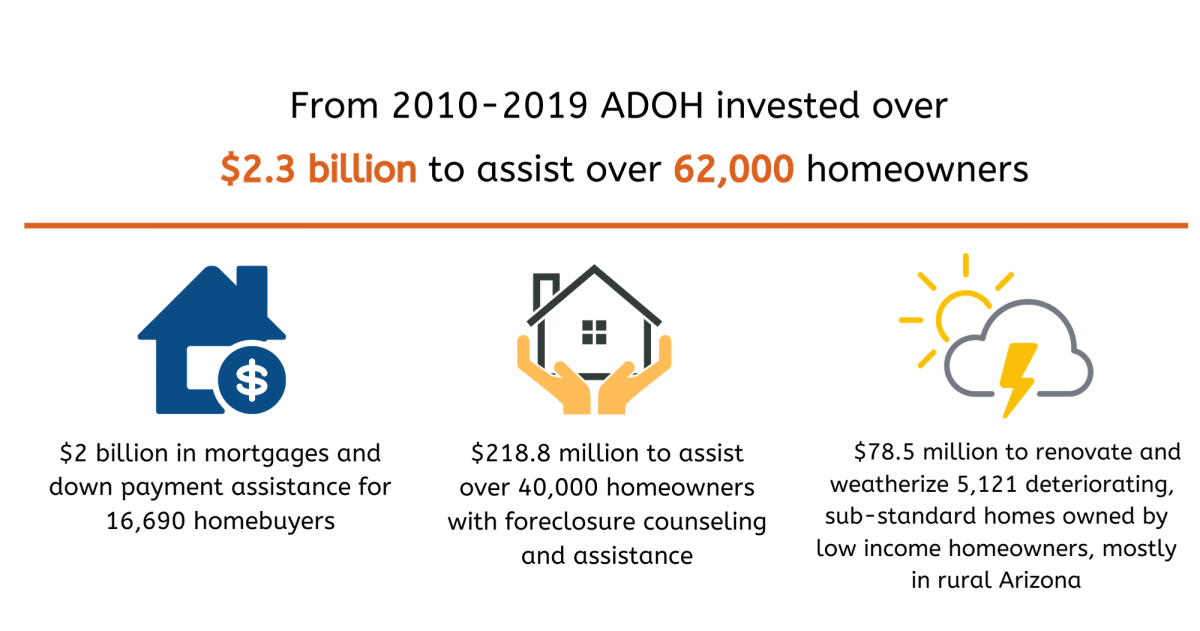
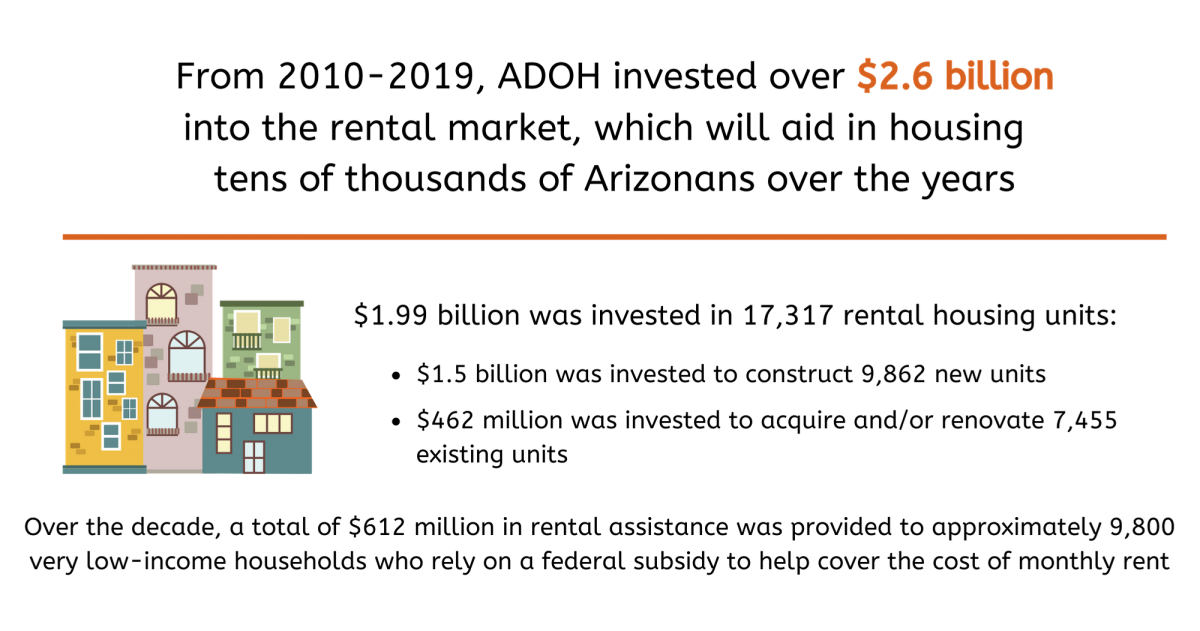
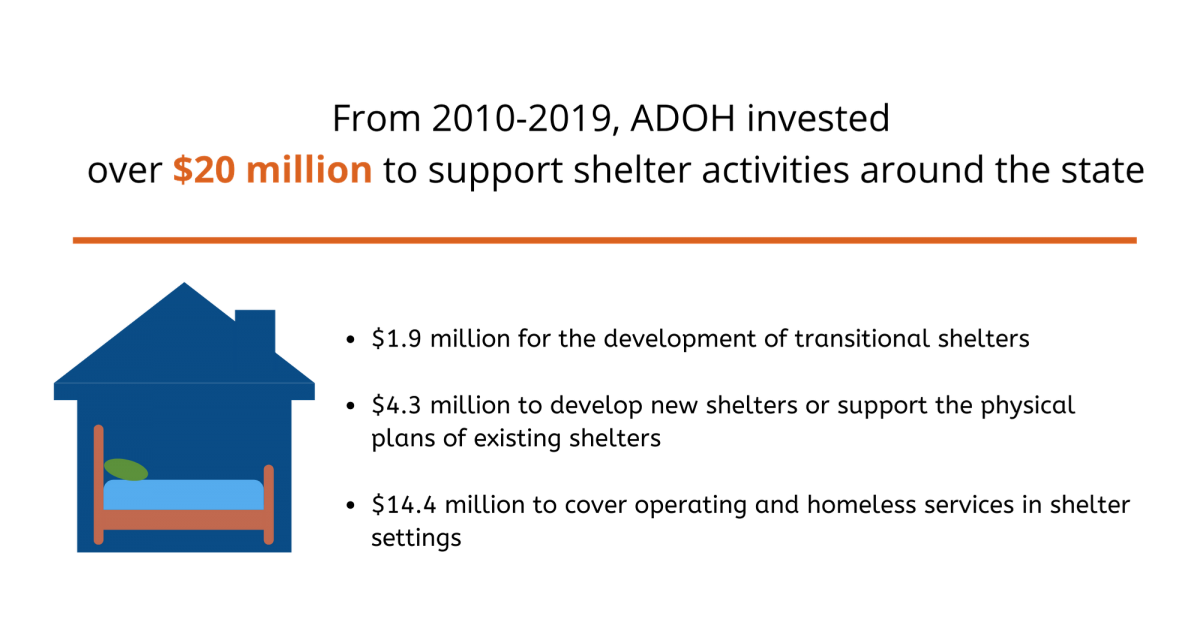
Arizona Department of Housing invested over $5 billion in resources to assist over 1.2 million
As the decade ends, Arizona sees improvements in homeownership, foreclosure, eviction, and homeless rates.
As the Arizona Department of Housing eagerly looks forward to 2020, we wanted to pause to reflect on the Arizona housing market over the last decade and where we are today. We are also pleased to share some of the Department’s investment strategies over this same period.
 When the decade began in 2010, Arizona was in the midst of the greatest housing crisis that it has experienced to this day. The foreclosure crisis and ensuing economic distress that led to record high unemployment, affected households at all income levels, causing increases in not only foreclosures, but also evictions and homelessness. The homebuilding and resale housing market all but dried up as foreclosed homes sat vacant, and homeowners with equity stayed put. “The recovery Arizona’s housing market has made over the past decade seems to go unrecognized,” stated Carol Ditmore, Director of the Arizona Department of Housing. "Arizona’s housing situation has certainly improved on a number of fronts over the past decade.”
Compared to 10 years ago, Arizona’s citizens are now more economically capable of covering the cost of living. In November 2009, Arizona’s unemployment rate peaked at 10.9 percent; in November 2019, it had fallen to 4.7 percent. Over the last five years, Arizona’s median household income grew by 21.5 percent, well above the U.S. average of 12.5 percent. Arizona’s poverty rate peaked at 19 percent in 2011; by 2018, it reduced to 14 percent.
Homeownership
In June 2010, when the Department submitted an application to the U.S. Department of the Treasury for its first grant ever to combat foreclosure, Arizona’s foreclosure rate was second in the nation. From 2007-2016, nearly 400,000 foreclosures took place in Arizona, and in December 2010, more than 49,000 foreclosed homes stood vacant. To put the foreclosure crisis numbers in perspective, during the third quarter of 2019, 2,073 foreclosures occurred in Arizona. Today Arizona’s foreclosure rate has fallen to very low, pre-recession levels, currently ranked 31st in the nation, and has recovered better than the other nine states most effected by foreclosures.
When the decade started in 2010, Arizona’s homeownership rate was about what it is today. In the aftermath of the economic downturn, Arizona’s homeownership rate bottomed out in 2016 at 61.7 percent. As of the second quarter 2019, Arizona’s homeownership rate now exceeds the national average at 67.4 percent. New home construction permits are on a steady, upwards trend. In 2018, 31,500 permits for single-family homes were issued. Homebuilders in Arizona have realized that there is a strong demand for housing in every category, including a pent up demand for entry-level housing, and as a result, over the past couple of years have made additional efforts to provide more entry-level housing.

Rental Market
At the start of the decade, approximately 30 percent of Arizona’s households were renting; in 2019, the percentage remains about the same, but the actual number of renter households has increased due to a net population increase of over half a million moving into the state. During the decade, the percentage of renters fluctuated and increased for a period of time, because of the number of households who fell out of homeownership from 2010 to 2016, after experiencing foreclosures.
As the foreclosed inventory of single-family homes increased, investors began purchasing a significant number of bank owned properties, so that homes that were once owner-occupied transitioned to renter-occupied. During the early years of this transition, and because of the high level of availability, single-family rents were considered reasonable. With the economy not fully recovered and the state’s growth slowed, rents were not seeing year over year increases during the first half of the decade. However, as the years progressed, the population began to grow again and new households formed, causing the availability of rental units to tighten and rents to rise. Landlords who had not been able to impose rent increases in the first half of the decade made up for it in the second half.
As the economy picked up and sensing a market for new rental units, developers have shown an interest in the construction of new rental properties in the past several years, and have almost universally chosen to focus on luxury properties.
There is no way to know how many Arizona households are truly burdened by their housing costs, but the National Low Income Housing Coalition has asserted that there is a need for approximately 150,000 units to meet the affordability needs of extremely low-income households in the state.
As the decade winds down, the Department has steered its competitively awarded federal Low-Income Housing Tax Credit resources toward new construction in order to add as many new units to Arizona’s affordable housing stock as it can. Given that public resources will never come close to filling the needs of extremely low-income Arizonans, the Department is also working to engage the private sector in affordable and workforce housing.

Today there is a widely held perception that today’s renters are experiencing the worst Eviction rates in our state’s history. If you review the decade’s eviction data, however, this does not appear to be the case. Eviction-related statistics are often misunderstood. Figures most often quoted are the number of eviction filings with the courts; however, prior to going to court, a significant percentage of those situations self-resolve.
In Maricopa County where eviction numbers are the highest in the state, the number of eviction filings, as well as judgements held relatively steady throughout the decade, even at a time when the number of renters increased, so that both filings and judgements on a per capita basis steadily decreased throughout the decade. Additionally, when compared to the latter half of the last decade, the number of filings and judgements are all significantly lower. For instance, in 2008 there were 80,764 filings and 56,636 judgements in Maricopa County. In 2018, there were 65,892 filings and 43,773 judgements.
At the beginning of the decade, the Department deployed federal stimulus funds made available to help resolve evictions, however, once that funding ended, the Department provided very small levels of assistance in the ensuing years. In 2019, the Department began offering an Eviction Prevention Program pilot limited to renters in zip codes experiencing the highest levels of evictions, to see if a concentrated effort to aid families experiencing a one-time crisis could avoid eviction with limited assistance. An analysis of the program’s effectiveness will be conducted in 2020, and will help determine future assistance levels.

Homelessness
Today, another widely held perception is that Arizona’s homeless population is rapidly increasing; if you review historical data, however, such is not the case. Homeless populations are difficult to count, but the most widely accepted indicator of homeless figures is the annual census conducted nationally in January of each year on behalf of the federal government, called the Point-in-Time (PIT) Count. While the method certainly is not perfect, it provides a good indicator of whether figures are going up or declining.
In January 2010, Arizona’s statewide PIT count was 13,711; Arizona’s 2019 PIT count was 10,007, showing a reduction of 3,704, or a 27% reduction during the decade. Over that time Pima County’s homeless numbers, declined by 62 percent, for a total of 2,271; Arizona’s 13 rural counties improved, decreasing 34 percent, for an overall decrease of 1,048.
Maricopa County experienced an overall decline in homelessness of 5.5 percent, from 6,999 in 2010 to 6,614 in 2019, a decrease of 385. Maricopa County’s unsheltered numbers, however, appear to be increasing, up 459 from 2,729 in 2010 to 3,188 in 2019, while the county’s sheltered count decreased 844, from 4,270 in 2010 to 3,426 in 2019.
We also know from analyzing the State’s Homeless Management Information System (HMIS) that Arizona’s homeless service providers interacted 32,234 times with people seeking assistance during federal FY 2018, which is 5,170 less interactions than occurred in 2017.
Some of the progress is attributable to the prioritization of the development of new supportive housing projects, where formerly homeless individuals not only live in a unit affordable to them, but also receive services aimed at helping them to stay housed. Over the past decade, the Department helped finance over 1,000 such units through its rental programs.
With Maricopa County’s unsheltered homeless numbers moving in the wrong direction, the Department is participating in an effort to address the issue, along with other state agencies. Particular emphasis is being made to address mental health and substance use, as the majority of unsheltered populations experiencing chronic homelessness struggle with these issues. The Department is also working to introduce new transitional housing opportunities, and additional supportive housing units.

While many of the statistics regarding housing challenges have showed some improvement, the Department remains dedicated to helping to address all of these areas with its available resources. The Department continues to look for ways to make the most efficient use of its resources in ways that make the biggest impact.
Housing Matters | Winter 2020